Your agent did what? A practical guide to run traces
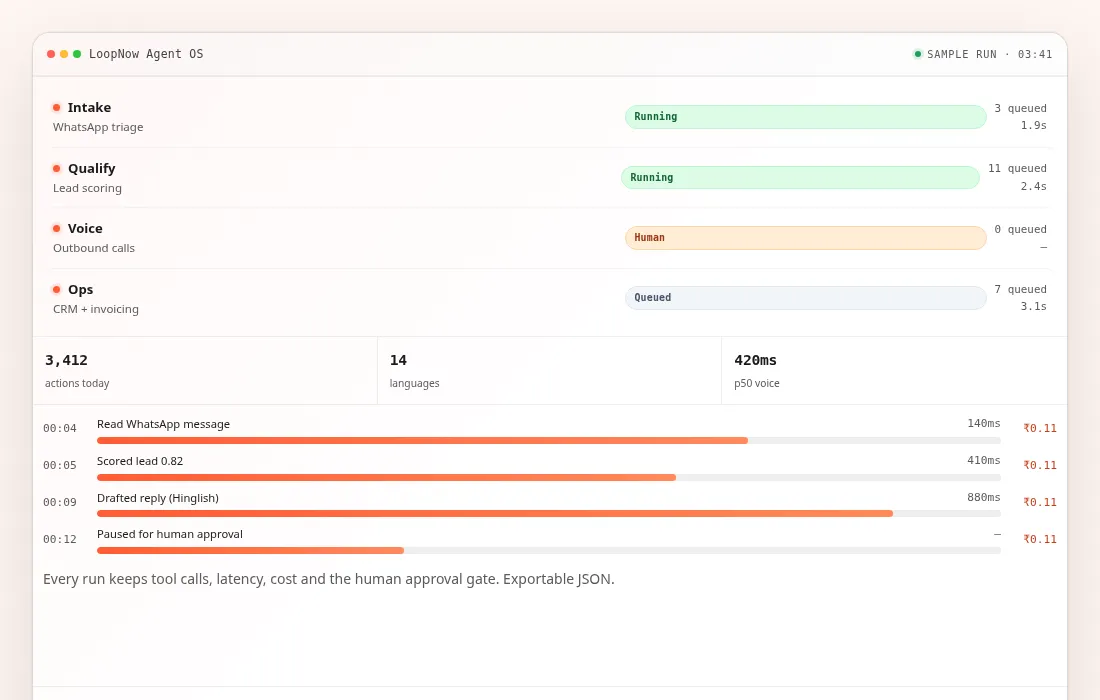
A chat transcript shows what the customer saw, not what the agent did: plan, tool call, latency, cost, consent check and the human gate.
A chat transcript is not observability. It shows what the customer saw, not what the agent did, which tool it called, how much it cost, or why it escalated.
A useful run trace has five parts: the plan, each tool call with latency, the token and rupee cost, the policy or consent check, and the human approval step. If a regulator asks “why did the agent send this?”, the trace is the answer.
Traces also make debugging cheaper. In our experience, most “the agent is wrong” reports are retrieval misses, stale context, or a tool returning an unexpected shape — all visible in the trace and invisible in the chat bubble.
Export the trace as JSON. Link it to the consent record. Set retention. Then you can improve the agent without guessing.
What this means for your team
Every action has a trace with tool, latency and cost.
Every consent has a notice version and a timestamp.
Every escalation has a named human and an audit entry.
Every number has a denominator and a window.
If a number in this article is not defensible, it does not ship. That is the editorial standard.
A chat transcript shows what the customer saw. A run trace shows what the agent did, in order, with the cost and the policy checks attached.
Record five things per run: the plan, each tool call, latency at p50 and p95, token cost in rupees, and the consent or approval gate that allowed the action.
Model runs as spans with a shared trace ID rather than as log lines, so a retry, a sub-agent and a human handoff can be read as one story.
Redact arguments by default and store hashes plus schema versions; a trace is an audit artefact, not a place to dump customer data.
Traces make the boring failures visible: retrieval misses, stale context, and tools that return a shape the agent never expected.
Observability will not tell you whether the agent is good for the business. That needs an evaluation set and a human scoring rule.
The transcript is a receipt, not an explanation
When an agent misbehaves, the first artefact most teams reach for is the chat transcript. It is easy to find, it is readable, and it shows exactly what the customer saw. It is also the least useful record of the failure, because it strips out every causal step between the customer’s message and the reply. The transcript shows a confident answer about a refund. It does not show that the refund tool returned a timeout, that the agent retried with an empty order ID, and that a fallback prompt invented a policy.
A run trace is the other half. It records the sequence of decisions the agent made, the tools it called with the arguments it sent, what came back, how long each step took, what it cost, and which policy or consent check allowed the step to happen at all. With that record, the same failure becomes a specific bug in a specific place. Without it, every incident review turns into a debate about what the model probably did.
Figure 1. The transcript is what the customer saw; the trace is the sequence of tool calls, checks and costs that produced it.
This distinction matters more in India than it does in a demo culture, because agents here are increasingly customer-facing in regulated or semi-regulated channels. A voice agent quoting an EMI, a WhatsApp agent confirming a delivery, an email agent promising a refund: each of those is an action with a commercial and sometimes legal consequence. The trace is how the company answers the question of why the action happened, months later, when the person who built the prompt has left.
Five fields that make a trace usable
A trace can carry hundreds of attributes and still be useless if the five important ones are missing. The first is the plan: what the agent intended to do before it started calling tools. The second is the tool call itself, with the name, the arguments, the result status and the duration. The third is latency, reported as a distribution rather than a single number. The fourth is cost, in tokens and in rupees, attached to the run rather than to a monthly invoice.
The fifth is the permission trail. Every consequential action should be traceable to something that allowed it: a consent record with a notice version, a policy decision from your own rules engine, or a human approval with a name and a timestamp. In a DPDP context this is the field that turns a log into evidence. It answers not only what happened but under which basis it was permitted to happen.
Figure 2. Five parts turn a run into evidence: intent, action, observation, authority and cost.
Teams often build the first four and skip the fifth, because it is the one that requires product work rather than an SDK. That is a mistake with a long tail. A trace that shows a message was sent but not why the recipient was eligible is an operational record. A trace that links the send to a consent event, a purpose and a template version is an audit record, and it is the difference between answering a data-principal request in an hour and reconstructing it over a week.
Plan: the intended steps before execution, not a retconned summary.
Tool call: name, arguments, result status, duration, retry count.
Latency: per-span timing that can be aggregated to p50 and p95.
Cost: input and output tokens, model name, rupee value at contract rates.
Authority: consent version, policy decision or named human approval.
Model a run as spans, not as log lines
The practical way to get all five fields without inventing a format is to borrow the tracing model that distributed systems already use. A trace is one end-to-end operation. A span is one unit of work inside it, with a start time, an end time, a parent and a set of attributes. A run becomes a trace; the model call, each tool call, each retrieval and each human handoff become child spans. The resulting tree is readable by existing tooling and survives a change of vendor.
OpenTelemetry’s semantic conventions for generative AI systems describe attributes for model name, token counts, operation type and tool calls, and the conventions are explicitly marked as evolving. That is a feature and a warning. Adopting the shape early means your traces are legible to a growing set of backends; adopting the exact attribute names without a mapping layer means a rename can break your dashboards. Keep a small internal schema, map it to the convention, and version the mapping.
Figure 3. Spans leave the runtime through an exporter and a collector before storage, which is where redaction and sampling can be enforced.
The alternative, a flat log line per event, works until the first retry. A retry creates a second tool span, and a flat log cannot express that the second call exists because the first timed out. A sub-agent creates a nested run that a flat log flattens into an unreadable sequence. A human handoff creates a pause measured in minutes that a flat log will attribute to the model. The parent-child relationship is not decoration; it is the part that makes the timeline interpretable.
Recording a tool call without copying the customer into the log
The naive trace stores the full arguments and the full response for every tool call. That is wonderful for debugging and terrible for privacy, because the arguments frequently contain a phone number, an address, an order value, a prescription or a partial card number that a downstream system should never have echoed. A trace store with six months of raw arguments becomes a second, unmanaged copy of your most sensitive data, outside the retention policy you carefully built for the primary database.
The pattern that works is a split record. Store the tool name, a schema version, the argument keys, a hash of the canonicalised arguments, the result status and the duration in the trace. Store the full payload, if you must, in a separate store with its own access control, its own retention and its own encryption, referenced by an identifier. Most debugging questions are answered by the split record plus a way to escalate to the payload for a specific run with an approval.
Figure 4. A trace panel should show the argument hash and the redaction state before it shows any payload, so reviewers know what they are not seeing.
Hashing needs a stable canonical form or it is useless. Two calls with the same order ID but a different key order will hash differently, and you will conclude that the agent called the tool twice when it did not. Sort keys, normalise whitespace, pin number formatting, and include the schema version in the hash input. Then a hash match actually means the same call, and a hash mismatch in a retry is a real signal about nondeterminism in the planner.
Cost per run, in rupees, at contract rates
Token counts are an engineering metric; rupees are a business metric. The trace should carry both, because the people who approve a workflow and the people who tune a prompt are not the same people. Attach the model identifier, the input and output token counts, and the unit price used to convert them, so a later price change does not silently rewrite history. If you run multiple models, record which one handled which span.
For Indian teams the conversion has a twist that is easy to forget. Published platform rates are usually quoted exclusive of GST, so the cost a finance team sees is not the cost an engineer optimises. A plan allowance expressed in tokens converts to a rupee overage rate, and that rate carries eighteen percent GST on the invoice. If the trace shows a per-run cost without the tax treatment, the number will not reconcile with the bill and someone will spend a week looking for the gap.
Figure 5. Illustrative sample built to show the shape of per-run cost; the values are constructed for this article, not measured customer data.
Cost per run also needs a denominator to be meaningful. A run that costs a few rupees and resolves a query is cheap. The same run repeated four times because the agent could not confirm an order ID is expensive, and the trace shows the repetition as four tool spans rather than one. That is why cost belongs on the run and not only on the monthly invoice: the invoice shows the total, the trace shows which behaviour produced it.
Consent and purpose belong inside the trace
A trace that records a message being sent, without recording the basis for sending it, is not sufficient for a data protection review. The DPDP framework expects a fiduciary to be able to show notice, purpose and consent, and to honour withdrawal. If the agent is the thing that sends the message, the agent’s trace is the natural place to attach the evidence. That means a pointer to the consent record, the notice version the person saw, the purpose code, and the timestamp of the check.
The pointer should be immutable for the life of the trace. If a consent record is later withdrawn, the trace must still show that consent existed at the moment of the action, and the system must show that the withdrawal was honoured from that point forward. Overwriting the trace on withdrawal destroys the audit trail in the name of accuracy. The correct behaviour is append-only: the action happened under a valid basis, and a later event changed the basis for future actions.
Figure 6. The consent check sits before the tool call, and a refusal is a recorded outcome rather than an exception that disappears into a log.
There is a temptation to treat this as a compliance feature to add at the end, after the workflow works. In practice it changes the design. The planner needs to know which purpose it is operating under before it chooses a tool, the tool needs to refuse if the purpose does not match, and the trace needs to capture the refusal as a first-class outcome rather than as an error. Building that in later usually means rebuilding the tool layer.
The human gate is a span with a name on it
Escalation is where most agent programmes quietly fail. The agent hands off to a person, the person fixes the issue, the customer is satisfied, and the dashboard records a success. The trace, if it exists, shows a gap of eleven minutes with no spans, which is exactly where the interesting work happened. Who took the case, what did they see, what did they override, and did they have authority to do it.
A human approval should be modelled like any other step: a span with a start, an end, an actor identifier, the decision, the reason code and the payload that was approved. That makes two things possible. First, you can measure how often the agent asks for help and whether those requests were appropriate, which is the escalation-correctness question that matters more than raw automation rate. Second, you can answer the audit question of who authorised an action, which is not answerable from a chat transcript.
Figure 7. The eleven-minute pause is the part most dashboards hide; a trace shows it as a span with an actor and a decision.
The approval span should also record what the person was shown. If the reviewer approved a refund after seeing a summary that omitted the duplicate order, the failure is in the review interface, not in the reviewer’s judgement. Capturing the presented context turns a blame question into a design fix, and it is the kind of detail that only a trace makes visible.
Sampling, retention and the cost of remembering
Storing every trace forever is the easiest policy to write and the hardest to defend. A trace contains behavioural data about identifiable people: what they asked, when, from where, and what the business did in response. Keeping it indefinitely creates a growing secondary data store with a weak justification. Keeping it for too short a time makes debugging impossible and destroys the audit trail that made the trace worth building.
A workable default is tiered. Keep full traces with payload references for a short operational window, keep the metadata-only record for a longer compliance window, and keep aggregated metrics indefinitely because they contain no personal data. Sample aggressively for high-volume, low-consequence runs such as read-only lookups, and sample not at all for consequential actions such as payments, refunds, consent capture and escalations. Tail sampling, where the decision is made after the run finishes, lets you keep every failure and discard most successes.
Figure 8. Retention is a set of tiers with different contents, not a single number; the deletion boundary has to be tested, not documented.
Retention needs an owner and a deletion job that is tested. A policy in a wiki is not retention. Write the deletion, run it against a staging store, confirm that the payload reference is removed along with the payload, and confirm that the aggregate still makes sense when the detail is gone. The test that matters is the one where someone asks for a run from fourteen months ago and the system gives a clean answer about what was kept and why.
A failure taxonomy the trace can actually prove
Most incident reports describe a symptom and guess at a cause. A trace lets you classify the failure with evidence, which changes the fix. The first class is retrieval: the answer was wrong because the document that contained the right answer was never retrieved, or the wrong version was. The trace shows the query, the chunk identifiers, the scores and the filters, and the fix is in the index or the query, not in the prompt.
The second class is context: the right document was retrieved but the model did not use it, because the window was crowded, the instruction conflicted, or the relevant passage was buried under a tool result. The trace shows what was in the context and in what order. The third class is tool shape: the tool returned a success with an unexpected schema, and the agent improvised. The trace shows the raw response next to the schema version, which is usually enough to reproduce the bug in a test.
Figure 9. Classify before you fix: each branch points at a different owner and a different kind of test.
The fourth class is policy: the agent tried to do something it should not, and either the guard refused or, worse, nothing did. The trace shows the intended action and the authority check, and the fix is a rule, not a prompt. A fifth class, model quality, is real but rarer than the other four in production tickets. Naming it first is a habit that hides the cases where the model was fine and the plumbing was not.
A worked debugging session, with constructed numbers
Here is an illustrative example, built to show the method rather than a real customer result. A support agent handles order-status questions on WhatsApp. Over a week the team sees a complaint rate that looks higher than usual, but the transcript sample looks fine: polite answers, correct tone, no obvious hallucination. The trace tells a different story. The order lookup span has a p95 of several seconds, the retry count is elevated, and a meaningful share of runs end with the agent answering from the last known order rather than a live lookup.
The cause turns out to be a tool contract problem rather than a model problem. The lookup service began returning a partial response under load, with the order status present but the shipment events missing. The agent’s prompt said to summarise the latest shipment, so it summarised an empty list as though nothing had shipped. The trace shows the empty array next to a success status, which is the signature of a schema that permits an incomplete object without signalling it.
Figure 10. Illustrative sample of the before-and-after shape; the values are constructed, and the point is the gap between p50 and p95.
The fix has three parts. The tool now returns an explicit partial flag, and the agent treats a partial response as a reason to ask a clarifying question rather than to answer. The trace records the partial flag as an attribute, so the failure class is searchable. And an alert fires when the share of partial responses crosses a threshold that the team chose after looking at a week of normal traffic. None of this required a better model, which is the point of the example.
What a trace will not tell you
A trace is an operational record, not an evaluation. It can tell you that the agent answered in eight hundred milliseconds and called the right tool. It cannot tell you whether the answer was useful, whether the customer trusted it, or whether the resolution held three days later. Those questions need an evaluation set with human scoring, and a follow-up window that looks at what happened after the conversation ended.
It also cannot tell you whether the workflow should exist. A perfectly traced agent that saves a rupee per interaction while increasing returns and complaints is a well-instrumented mistake. The business case lives outside the trace: contact deflection that does not bounce back, revenue per conversation, error rates downstream, and the cost of the human review that the agent creates. Instrument those separately and join them by conversation identifier.
Figure 11. Traces explain behaviour; evaluations judge quality; business metrics decide whether the behaviour was worth having.
Finally, a trace is not a security control. It records what happened; it does not prevent the wrong thing from happening. Guardrails, scoped credentials, spend caps and approval thresholds do that. If a team tells you that observability is their safety story, ask what blocks an action in real time. The answer should be a rule, a permission or a person, with the trace as the record of the decision.
Build, buy, or instrument what you already have
If you already run a general observability stack, the cheapest path is to emit spans into it. You get retention, access control, alerting and a query language that your on-call team already knows. The cost is that agent-specific views, such as a readable plan tree or a cost-per-conversation report, have to be built on top. For a team with one workflow and an existing platform contract, that is usually the right trade.
A dedicated agent observability product makes sense when the number of workflows, models and reviewers grows past what a general dashboard can express, or when the compliance team needs a review interface that does not require a query language. The evaluation criteria are unglamorous: can it ingest OpenTelemetry spans, can it redact before storage, can it join a trace to a consent record, can it export everything as JSON on request, and what happens to your data when you leave.
Figure 12. The console is a per-run view for workflows built on the platform, not a general purpose APM replacement.
LoopNow records run traces for workflows built on the platform and exposes them per run, with cost and approval steps attached. It is not a replacement for application performance monitoring, and it will not instrument a service you run outside the platform. If your agent is a hand-rolled orchestrator on your own infrastructure, a tracing library plus your existing backend is the better answer, and this page should have given you the schema to implement.
Frequently asked questions
What is the minimum viable trace for a small team?
Five fields on one row per run: a trace identifier, the tool calls with status and duration, the token counts, the consent or approval reference, and the outcome. You do not need a distributed tracing backend to start. A table with those columns, written by the orchestrator and exported nightly, will already answer most incident questions better than a transcript archive.
Should we store full tool arguments in the trace?
Not by default. Store the tool name, schema version, argument keys, a canonical hash and the result status in the trace, and keep the full payload in a separate store with tighter access and a shorter retention. Escalate to the payload for a specific run when you need it, with an approval and an access log entry.
How do we measure agent latency properly?
Measure per span and aggregate to percentiles, not averages. Report p50 and p95 at minimum, and separate model time from tool time from queue time. A single end-to-end average hides the tail that customers actually complain about, and it hides whether the delay came from the model, a downstream API or your own scheduler.
Does a trace satisfy a DPDP audit request?
It helps, but only if it links the action to a lawful basis. A trace that records a message being sent is an operational log. A trace that records the consent record, notice version, purpose and timestamp is audit evidence. The trace also has to survive withdrawal without being overwritten, and the retention policy for traces has to be defensible on its own.
What should trigger an alert?
Alert on the failure classes, not on raw error counts: a rise in partial tool responses, a spike in retries for one tool, an increase in escalations with a specific reason code, and a p95 breach on a customer-facing span. Also alert on the absence of data, because a silent exporter looks exactly like a healthy system until someone needs a trace.
How long should we keep traces?
Long enough to investigate a complaint that arrives late and to satisfy the retention you have promised, and no longer. A tiered approach works: full detail for a short window, metadata for a longer compliance window, aggregates indefinitely. The exact periods depend on your sector and contracts, so decide them with the people who own privacy and legal, not with the engineering team alone.
Can we trace a voice agent the same way?
Yes, with extra care. The audio is personal data, and the transcript is personal data, so both need their own retention and access rules. Trace the turn boundaries, the recognition confidence, the tool calls made during the call, the transfer decision and the recording consent. Keep the audio reference separate from the trace and delete it on its own schedule.
What is the difference between observability and evaluation?
Observability records what happened in production. Evaluation judges whether what happened was good, using a task set and a scoring rule. A trace can show that an answer took 800 milliseconds and cited the right order; only an evaluation can tell you whether the customer would consider that answer correct. You need both, and they should share a conversation identifier.
Is OpenTelemetry the right foundation for agent traces?
It is a reasonable default because it is vendor-neutral and the generative AI conventions, though still evolving, describe the right shape: spans for model calls and tool calls, attributes for tokens and model identity. Keep your own internal schema and map to the convention so that a rename in the specification does not break your dashboards.